
Olabi Sutras
Retail Root Cause Analysis: Understanding Why Sales Changed
A change in sales is often the first signal that something in the retail business has shifted. Sales may suddenly decline across a group of stores, while a particular product category may unexpectedly begin outperforming others.
The numbers clearly show what happened, but they don’t necessarily explain why it happened.
Was the decline caused by lower footfall? Were customers visiting but not converting? Did key products go out of stock? Did pricing change? Was there a new competitor in the market? Or did a promotional campaign change customer demand?
For retailers managing multiple stores, products, and channels, answering these questions quickly can be difficult when performance data is spread across different systems and reports.
This is where Retail Root Cause Analysis becomes important. Rather than stopping at the visible change in performance, it involves tracing that change back to the underlying factors that caused it.
Retail performance data tells you what changed. Retail Root cause analysis helps explain why.
What Is Retail Root Cause Analysis?
Retail Root Cause Analysis is the process of investigating a change in retail performance to identify the underlying factors responsible for it.
A sales report might show that revenue has fallen by 10%, but that number alone doesn’t tell a retailer what action to take. Retail Root cause analysis looks deeper into the different factors that influence performance and connects them to the observed outcome.
For example, a retailer may notice that sales have declined at several stores. The first assumption might be that customer demand has weakened. But further analysis could reveal that footfall has remained stable while conversion has fallen. Looking deeper may then show that several high-demand products have been out of stock.
The investigation could look like this:
Sales declined → Footfall remained stable → Conversion declined → Key products were unavailable → Stock replenishment was insufficient
In this case, the sales decline was not necessarily caused by a lack of customer demand. The underlying issue was product availability.
This is what makes Retail Root Cause Analysis different from simply reviewing performance reports. Traditional reporting primarily tells retailers what happened, while retail root cause analysis attempts to understand the factors that produced the result.
A single outcome can also have multiple contributing factors. Sales could decline because of a combination of lower footfall, weaker conversion, reduced product availability, and increased competition. Identifying these relationships allows retailers to separate the primary cause from secondary factors.
The objective, therefore, isn’t simply to find something that appears to correlate with a sales change. It is to identify a meaningful and actionable cause that can help the retailer determine what needs to change.
Start With the Change, Not the Assumption
When retailers notice a sudden change in performance, it can be tempting to immediately search for an explanation. However, starting with an assumption can lead the analysis in the wrong direction.
A better approach is to first establish exactly what changed, where it changed, when it changed, and how significant the change actually was.
What Changed?
The first step is to identify the specific performance metric that has moved.
This could include:
- Sales: Has revenue increased or declined compared with the expected or historical baseline?
- Units sold: Is the change in revenue being driven by selling more or fewer products?
- Average Order Value: Are customers spending more or less per transaction?
- Gross margin: Has profitability changed even if sales remain stable?
- Conversion rate: Are fewer visitors turning into buyers?
- Footfall: Has the number of customers visiting stores changed?
- Sell-through: Are products moving through inventory at the expected rate?
Looking at these metrics together is important because they can tell very different stories.
For example, a 10% decline in sales could result from fewer customers visiting the store, a lower conversion rate, a reduction in average basket size, or a combination of all three.
Where Did It Change?
Once the change has been identified, retailers need to determine where the variance is concentrated.
The change could occur at different levels:
- Store: Is the issue isolated to one or a few locations?
- Region: Are multiple stores in the same geographic area experiencing the same pattern?
- Store cluster: Are stores with similar characteristics showing a common trend?
- Product category: Is the change concentrated in footwear, apparel, electronics, beauty, or another category?
- SKU: Is a specific product or variant driving the change?
- Channel: Is the change occurring online, in physical stores, or across both?
This step prevents retailers from treating a localized problem as a company-wide issue.
For example, if overall sales are declining by 5% but the majority of that decline comes from a particular store cluster, the retailer can focus its investigation on those locations rather than changing its entire retail strategy.
When Did It Change?
Timing can provide important clues about what caused a performance change.
Retailers should establish whether the change occurred:
- Day: Did performance change suddenly on a particular day?
- Week: Did the trend begin during a specific week?
- Month: Is the change part of a broader monthly pattern?
- Season: Could seasonality explain the movement?
- Before vs. after a campaign: Did performance change following a promotion, advertising campaign, or pricing change?
Understanding timing helps retailers connect performance changes with events that may have influenced them.
For example, if sales declined immediately after a promotion ended, the cause may be different from a gradual decline that has continued for several months. Similarly, a drop in sales for seasonal products may be expected rather than a sign of weakening product demand.
How Significant Was the Change?
Not every performance fluctuation requires the same level of investigation.
Retailers need to determine whether the change is a normal variation or a meaningful deviation from expected performance.
This can involve comparing current performance against:
- Historical performance
- Forecasted demand
- Previous periods
- Store benchmarks
- Regional averages
- Category performance
- Similar stores or clusters
A small temporary fluctuation may not require immediate action. A sustained and significant deviation, however, may indicate an underlying operational or commercial issue.
Establishing the size, location, and timing of the variance gives retailers a clear starting point for deeper investigation.
Only after the change has been clearly defined should retailers begin asking why it happened. This prevents teams from jumping to conclusions and creates a more structured path from a performance signal to its underlying cause.
The Many Reasons Behind a Sales Change
A change in sales rarely has one obvious explanation. A decline in revenue, for example, could be caused by fewer customers entering the store, lower conversion, product availability issues, pricing changes, or several factors happening at the same time.
This is why retailers need to look beyond the sales number and examine the different drivers that influence it.
Customer Demand
Changes in customer demand can directly affect product and store performance. Customers may shift their preferences, respond differently to new trends, or change their purchasing behavior.
Factors such as:
- Changing customer preferences
- Shifts in buying behavior
- Seasonal demand
- Local market trends
can all influence sales. A decline in demand may indicate that a product is losing relevance, while a sudden increase could signal an emerging opportunity.
Store Traffic
Sales are also closely connected to how many customers visit a store. A decline in footfall can naturally lead to lower sales, even when conversion and product availability remain healthy.
Store traffic can be influenced by:
- Changes in footfall
- Location-specific events
- Weather conditions
- Nearby competition
For example, a local event, road closure, or new competitor opening nearby could temporarily change the number of customers visiting a particular store.
Product Availability
Sometimes customers are willing to buy, but the product they want simply isn’t available.
Stockouts, poor replenishment, inventory imbalance, and missing sizes or variants can all result in lost sales. This is particularly important when high-demand products are unavailable while excess inventory may be sitting in other locations.
In such cases, the sales decline may look like a demand problem when the actual issue is inventory availability.
Pricing & Promotions
Changes in pricing can also influence customer behavior. A product may experience lower demand after a price increase, while a promotion can temporarily increase sales.
Retailers should consider:
- Price changes
- Discounts
- Promotional campaigns
- Competitor pricing
A sudden sales increase, for instance, may appear to indicate stronger demand when it was actually driven by a temporary discount.
Store Execution
Even when demand and inventory are healthy, poor store execution can affect sales.
Issues with:
- Merchandising
- Planogram compliance
- Product visibility
- Store standards
can make it harder for customers to discover or purchase products. A product may be available in the store but fail to generate expected sales because it is poorly positioned or not being presented according to the intended merchandising strategy.
Workforce
The people operating a store also influence its performance. Staffing levels, associate productivity, training, and peak-hour coverage can affect how effectively a store serves customers.
A store experiencing high footfall but insufficient staff during peak hours may have lower conversion simply because customers aren’t receiving the assistance they need.
All of these factors demonstrate an important principle: sales are an outcome, not necessarily the root cause.
The real question isn’t simply “Why did sales fall?” but rather “What changed in the factors that influence sales?” Answering that question requires retailers to connect different performance signals and investigate how they relate to one another.
Tracing a Sales Decline: From Symptom to Root Cause
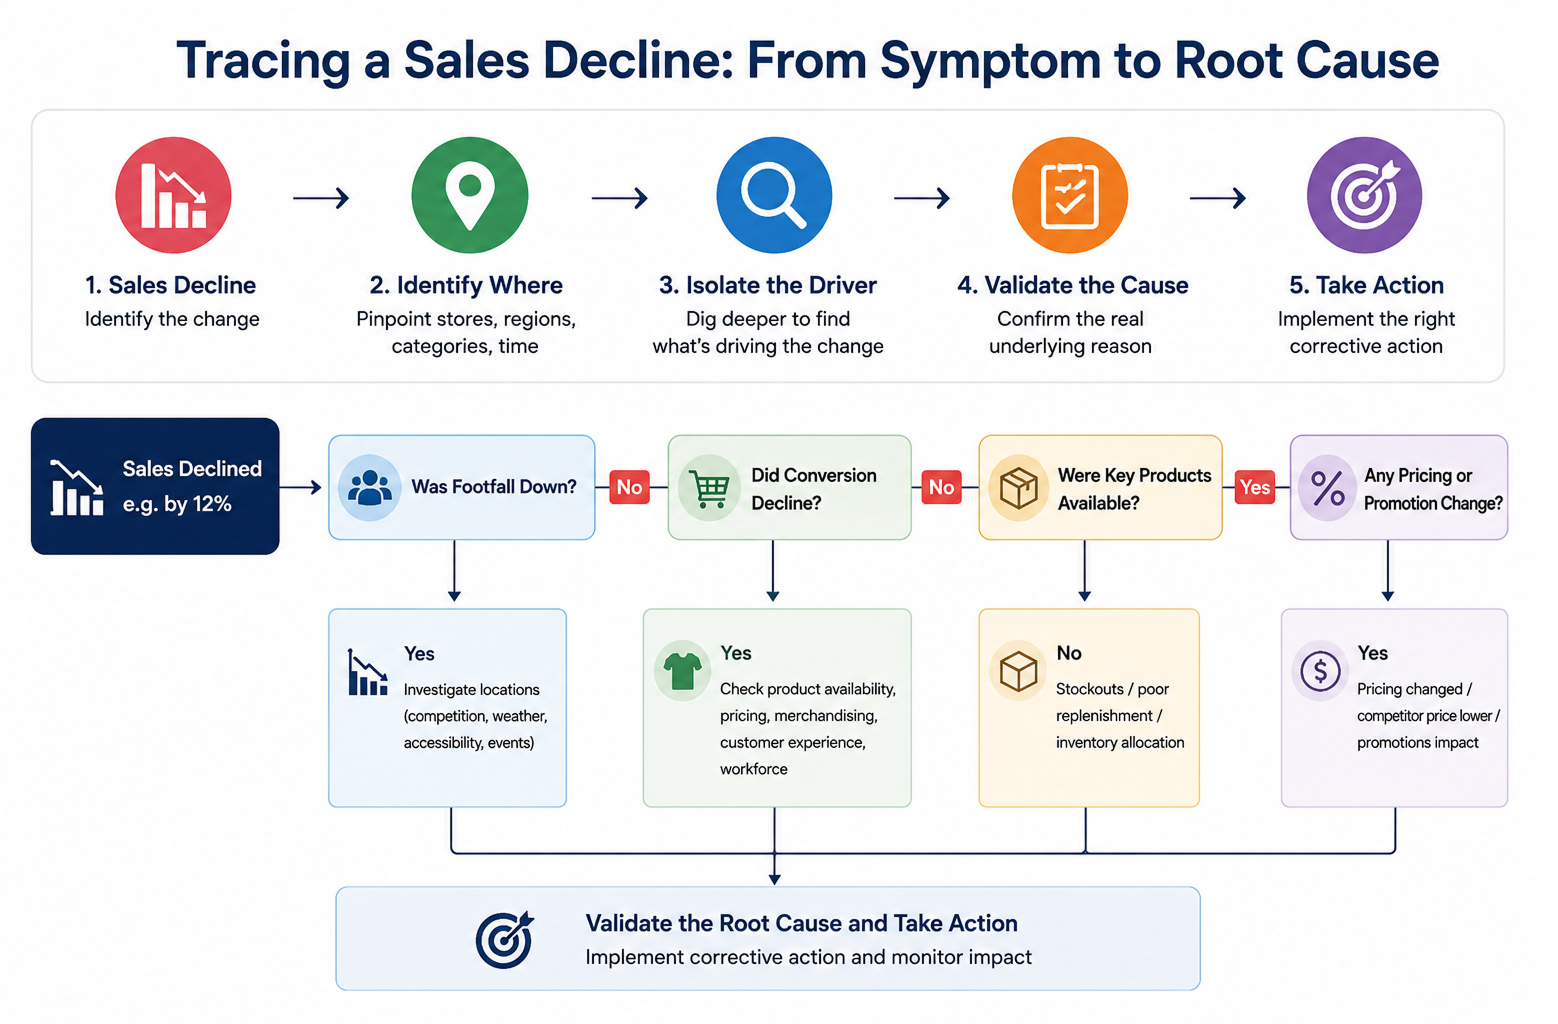
Once a retailer identifies a significant sales decline, the next step is to investigate it systematically rather than immediately assuming what caused it.
A useful approach is:
Sales Decline → Identify Where → Isolate the Driver → Validate the Cause → Take Action
Imagine a retailer discovers that sales have declined by 12% across its network.
The first question should be:
Was Footfall Down?
If footfall has also declined, the retailer can investigate whether the change is concentrated in particular stores, regions, or time periods.
For example:
Sales ↓ 12% → Footfall ↓ 15% → Decline concentrated in 8 stores
The investigation can then focus on what changed in those locations, perhaps local competition, weather, store accessibility, or a location-specific event.
But what if footfall remained stable?
Did Conversion Decline?
If customers are still visiting stores but fewer are making purchases, the problem may lie elsewhere.
The investigation could continue:
Sales ↓ 12% → Footfall stable → Conversion ↓
Now retailers can examine product availability, pricing, merchandising, customer experience, and workforce performance.
Were Key Products Available?
If conversion has declined, one of the next questions should be whether customers were able to find what they wanted.
For example:
Conversion ↓ → Key SKUs unavailable → Stockouts increased
This could indicate a replenishment or inventory allocation problem rather than a decline in customer demand.
Was Inventory Actually Available?
If inventory is available, retailers can investigate other potential drivers.
For example:
Inventory available → Pricing changed → Competitor price lower
In this scenario, the issue may be pricing rather than inventory or demand.
This approach prevents retailers from stopping at the first explanation they find. Instead, each finding becomes another question in the investigation until the underlying driver becomes clearer.
The ultimate objective is to move from a broad performance observation to a specific, actionable cause.
The Difference Between a Symptom and a Root Cause
One of the biggest challenges in retail analysis is confusing a symptom with the actual cause of a problem.
Consider a simple example:
Symptom: Sales declined.
A retailer investigates further and discovers:
Possible cause: Conversion declined.
That is useful information, but conversion itself may only be another symptom.
The retailer needs to ask why conversion declined.
Perhaps:
- Key SKUs were unavailable.
- Customers couldn’t find their preferred sizes.
- Store associates were understaffed.
- Product placement had changed.
- Competitor pricing had become more attractive.
The investigation might eventually reveal:
Sales decline → Conversion decline → Product availability issue → Key SKUs out of stock
In this example, conversion decline is a contributing factor, but the stockout may be much closer to the underlying operational cause.
This distinction matters because different levels of the problem require different actions.
Symptom
What the retailer can immediately observe.
Example: Sales are down.
Contributing Factor
Something that influenced the outcome.
Example: Conversion has declined.
Root Cause
The underlying issue that can be addressed to prevent or correct the problem.
Example: High-demand SKUs were not replenished on time.
Without making this distinction, retailers may address the symptom rather than the problem itself. For example, launching another promotion may temporarily increase sales, but if the real issue is product availability, the underlying problem remains.
Effective Retail Root Cause Analysis helps retailers move through these layers and identify the issue that actually requires intervention.
The goal is not simply to explain a performance change. It is to understand what caused it, what can be changed, and whether that change will prevent the same problem from happening again.
When the Same Sales Change Means Different Things
A sales change on its own rarely tells the complete story. The same decline in sales can have completely different causes depending on what is happening with footfall, inventory, conversion, pricing, and other surrounding metrics.
Consider a few common scenarios.
Example 1: Sales Down + Footfall Down
If both sales and footfall have declined, the issue may be related to store traffic rather than store execution.
Possible factors include:
- Lower customer traffic
- Changes in the local market
- Seasonal demand shifts
- Weather or external events
- Increased competition nearby
In this situation, improving inventory or adding more staff may not solve the underlying problem. Retailers may instead need to investigate local marketing, customer engagement, or external market conditions.
Example 2: Sales Down + Footfall Stable
Here, the story is different. Customers are still coming into the store, but fewer are completing purchases.
Possible causes include:
- Lower conversion
- Product availability issues
- Pricing changes
- Poor customer experience
- Merchandising problems
- Associate performance
The investigation should therefore move beyond traffic and focus on what happens between store entry and checkout.
Example 3: Sales Down + Inventory High
High inventory alongside declining sales can be a strong signal that products are not moving as expected.
Possible causes include:
- Weak customer demand
- Poor assortment decisions
- Products losing relevance
- Overstocking
- Incorrect allocation
The issue may not be that the store lacks products, it may have too many of the wrong products.
Example 4: Sales Up + Margin Down
A sales increase doesn’t always represent improved business performance.
If revenue is growing while margins are declining, retailers may need to investigate:
- Excessive discounting
- Changes in product mix
- Heavy promotional dependency
- Lower-margin products driving sales
The retailer may be selling more but earning less from each transaction.
These examples demonstrate why Retail Root Cause Analysis cannot rely on a single metric. Sales provide the initial signal, but the surrounding data provides the context needed to understand what is actually happening.
The same sales number can tell very different stories depending on what sits behind it.
Retail Root Cause Analysis at the Store and SKU Level
Retail performance can look healthy at an overall business level while important problems remain hidden underneath. This is why retail root cause analysis needs to move beyond company-wide numbers and examine performance at a more granular level.
A retailer can investigate changes across several layers:
- Store level: Identify individual locations experiencing unusual performance changes.
- Region level: Determine whether a trend is specific to a particular geographic market.
- Store cluster: Compare stores with similar characteristics and identify common patterns.
- Category level: Understand which product categories are contributing to the change.
- SKU level: Identify the specific products or variants driving the movement.
- Customer segment: Examine whether particular customer groups have changed their purchasing behavior.
- Channel: Determine whether the issue exists in physical stores, online channels, or across both.
For example, a retailer may see that overall regional sales are healthy. At first glance, there may appear to be no significant issue. However, a deeper analysis could reveal that three stores within the region are significantly underperforming while the remaining locations are compensating for the decline.
The same principle applies to products. A category may show stable sales overall, while several important SKUs within that category could be experiencing significant declines. Other products may be growing fast enough to hide the weakness at the category level.
This is why retailers need the ability to drill down from aggregate performance into the specific locations, products, and customer behaviors driving the change.
The more granular the analysis, the easier it becomes to move from a broad observation to a specific business problem and eventually to the right action.
The Data Retailers Need to Find the Real Cause
Effective Retail Root Cause Analysis depends on having enough evidence to connect performance changes with their underlying drivers. Looking at sales data alone can identify that something changed, but combining multiple data sources provides the context needed to understand why.
Retailers may need to connect:
POS Sales
Provides transaction-level information such as sales value, units sold, products purchased, and transaction trends.
Inventory
Shows whether products were actually available when customers wanted them and helps identify stockouts, excess inventory, and inventory imbalances.
Product Availability
Helps determine whether poor sales are the result of weak demand or customers simply being unable to purchase the products they wanted.
Footfall
Provides context around store traffic and helps distinguish between declining demand and declining conversion.
Customer Data
Provides insight into changes in customer behavior, purchasing patterns, preferences, and engagement.
Loyalty Data
Can reveal changes in repeat purchasing, loyalty engagement, and customer activity.
Pricing & Promotions
Helps retailers understand whether price changes, discounts, or campaigns influenced customer behavior.
Store Operations
Operational data can highlight issues involving merchandising, compliance, execution, and store-level processes.
Workforce Data
Staffing levels, productivity, training, and peak-hour coverage can help explain changes in customer experience and conversion.
Historical Performance
Historical data establishes a baseline and helps retailers distinguish between normal fluctuations and unusual performance.
External Factors
Weather, local events, competition, holidays, and other market conditions can sometimes explain changes that internal retail data alone cannot.
The important point is that individual datasets provide clues, but connected data provides context.
When these signals are brought together, retailers can build a more complete picture of what is happening across stores, products, customers, and channels. This makes it easier to identify meaningful patterns and investigate potential causes before they turn into larger performance problems.
Turning Root Cause Insights Into Action
Finding the reason behind a performance change is only valuable if it leads to the right business action. The purpose of Retail Root Cause Analysis isn’t simply to explain what went wrong, it is to help retailers determine what should happen next.
Different causes require different responses.
If the Cause Is Stockouts
If strong customer demand is being affected by unavailable products, retailers can respond by improving replenishment, increasing allocation, or redistributing inventory from locations with excess stock.
The objective is to restore availability where demand exists.
If the Cause Is Poor Conversion
When footfall is healthy but conversion is declining, retailers may need to investigate product availability, merchandising, customer experience, or associate performance.
Possible actions could include improving product presentation, addressing availability gaps, or providing store-level coaching.
If the Cause Is Excess Inventory
If declining sales are accompanied by high inventory, continuing to replenish the same products can make the problem worse.
Retailers may need to rebalance inventory, adjust future allocations, revise the assortment, or introduce targeted markdown strategies to improve inventory productivity.
If the Cause Is Pricing
If sales performance has changed following a price adjustment or because competitors are offering more attractive prices, retailers can review their pricing and promotional strategy.
The objective should be to understand whether additional discounting will genuinely improve profitability or simply increase sales at the expense of margin.
If the Cause Is Low Footfall
When the primary issue is declining store traffic, retailers may need to examine local marketing, customer engagement, store visibility, location-specific factors, or competitive activity.
The solution in this case may have little to do with inventory or store operations.
If the Cause Is Workforce Productivity
If staffing or associate productivity is affecting store performance, retailers can respond through better workforce scheduling, training, peak-hour staffing, and store-level coaching.
This can help ensure that stores have the right level of support when customer demand is highest.
The key is to match the action to the cause. Applying the same solution to every sales decline can waste resources and may fail to address the underlying problem.
Effective retail root cause analysis creates a clear chain:
Performance Change → Root Cause → Corrective Action → Measurable Result
This turns retail analytics from a reporting exercise into a practical decision-making process.
Conclusion
Retail performance is full of signals.
A sales decline, an increase in inventory, a drop in conversion, or a change in margin can tell retailers that something has changed, but the headline number rarely explains why.
That is why retailers need to look beyond sales performance alone and examine the factors influencing it.
Retail Root Cause Analysis provides a structured way to connect performance changes with inventory, customers, stores, pricing, promotions, and operations. By identifying the actual drivers behind a change, retailers can move beyond assumptions and take more targeted corrective action.
The goal is not simply to explain yesterday’s performance.
It is to understand the signals early, respond to the right problems, and make better decisions for tomorrow.
Turn Retail Data Into Better Decisions With Olabi
Olabi brings together the data retailers need to understand performance across their business, from POS data and inventory visibility to store performance, retail analytics, customer insights, and multi-store operations.
By connecting these data points, retailers can gain a clearer view of what is driving performance, identify issues faster, and make more informed decisions at the store, product, and business level.
Want to understand why your retail performance changes, not just what changed?
Discover how Olabi’s connected retail platform brings sales, inventory, customer, and store data together to identify performance drivers, make faster, smarter retail decisions, and take action with confidence. Schedule a demo with Olabi today.
Share This Story, Choose Your Platform!
About the Author: Olabi

